Step-by-Step Tutorial: Using Picometrics Meta Ads Looker Studio Connector
Step 1: Open Looker Studio
Go to Looker Studio and sign in with your Google account.
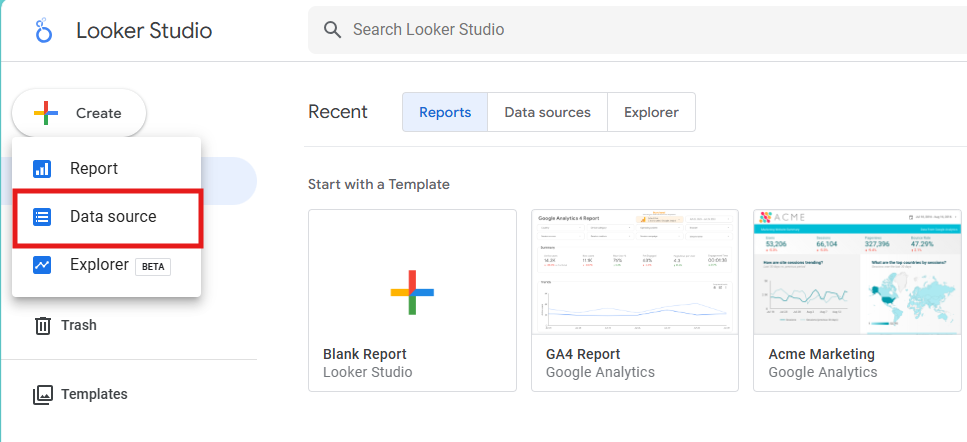
Step 2: Add a New Data Source
- From the Looker Studio homepage, click on “Data Sources” in the left-hand menu.
- Click on the “Add” button to create a new data source.
Step 3: Find the Picometrics Connector
Search for “Picometrics” in the connector gallery.
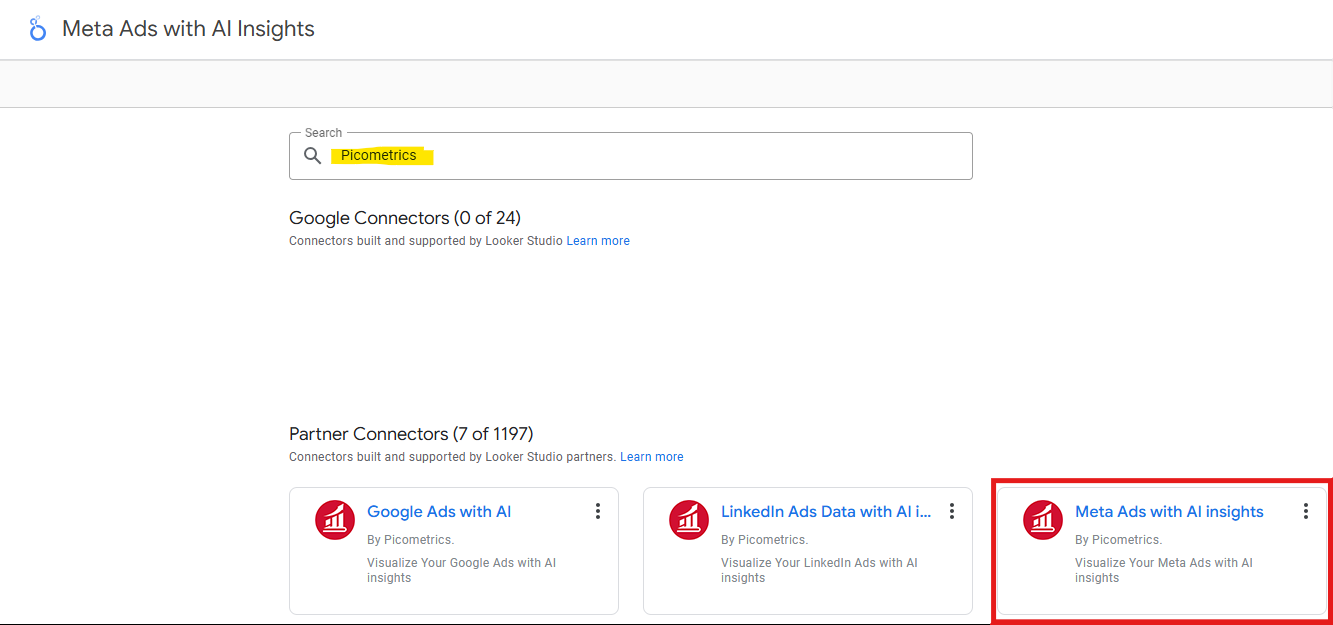
Type “Picometrics” in the search bar to find Picometrics connector.
Step 4: Connect to Picometrics
- Select and click the Picometrics connector from the list.
- Click on “Authorize” to allow Looker Studio to use the Picometrics connector. You must have the access rights to the platform (Meta Ads, LinkedIn Ads, Google Ads, GA4, ..) you want to use it for the connector. If you don’t have access rights to the platform, the connector will not be able to access your data, and bring it to your dashboard.
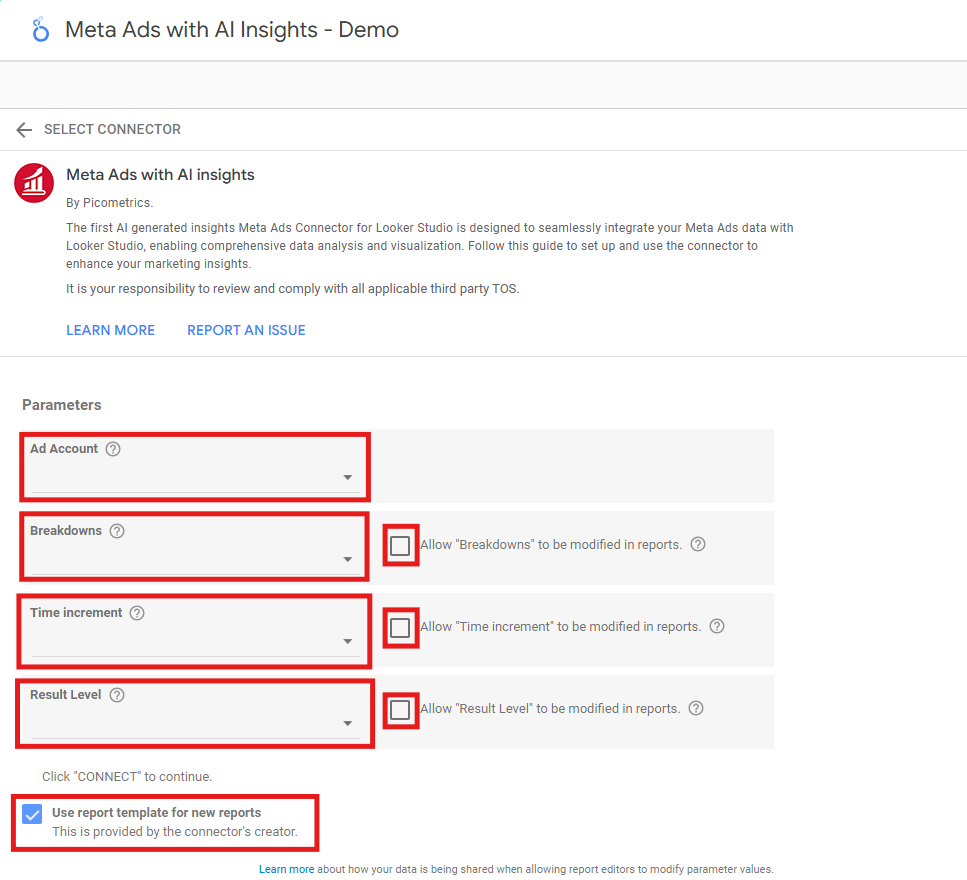
Step 5: Configure the Data Source
Follow the prompts to configure the data source. This may include selecting the relevant data fields and allowing some dimensions to be modified within the dashboard:
- Select the Ad Account you want to link to your datasource from the dropdown menu.
- Select the type of breakdown by which you want to group your data from the dropdown menu: No breakdown, Age or Gender, etc.
- Select the type of time increment by which you want to group your campaigns data. You may choose “All_days” to have the results for the whole period (recommended), or have results for smaller time slices. If “all_days” is used, it means one result set for the whole period. If “Monthly” is used, you will get one result set for each calendar month in the given period. If “Daily” is used, you can have one result set for each day.
- Select the level by which you want to group your data: you can get your data at the campaign level, the ad set level, the ads level, or the Account level, depending on the level of granularity you’d like for your report.
- Make sure to check all the radio buttons, so you can change these configuration settings from within the report later.
- If it’s your first report with this connector, it’s recommended to leave the box “Use report template for new report” checked, so you have a free template to present your data very quickly, and to get a sense on how the connector can be used.
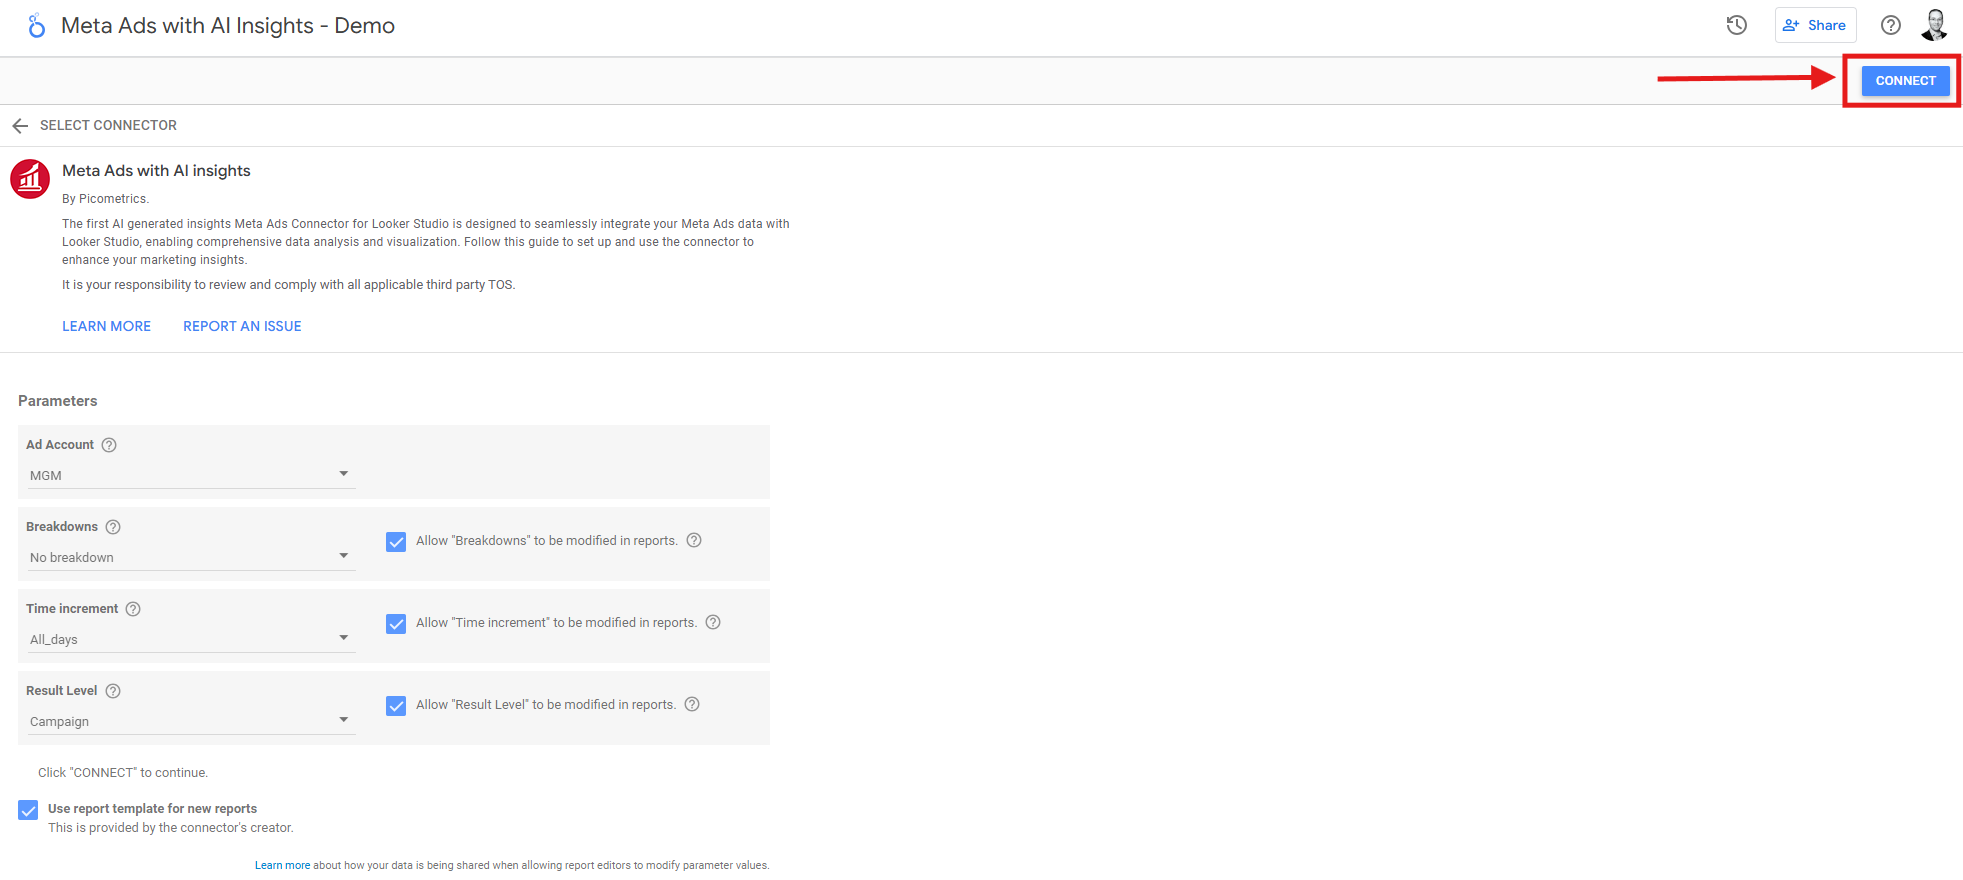
- Click on “Add” to add the configured data source to your list of available data sources.
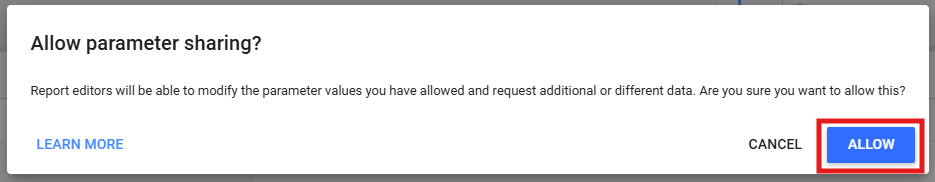
- Click on “ALLOW” button to be able to change the configuration parameters within your reports.
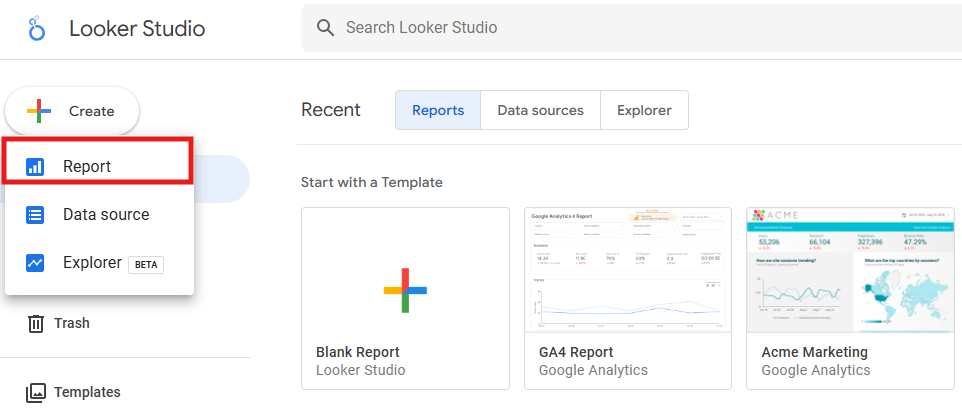
Step 6: Create a New Report
From the Looker Studio homepage, click on the “Create” button to start a new report.
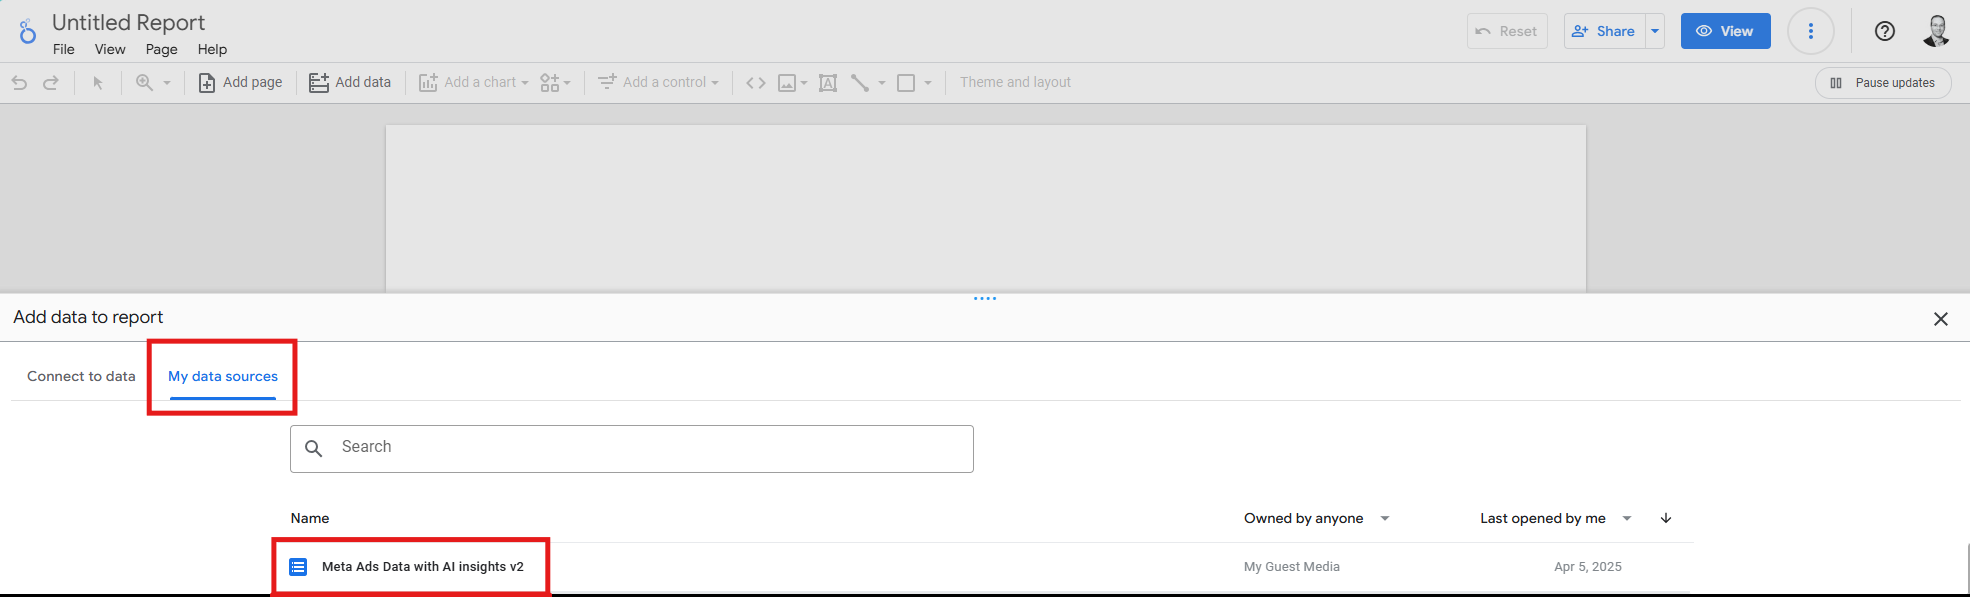
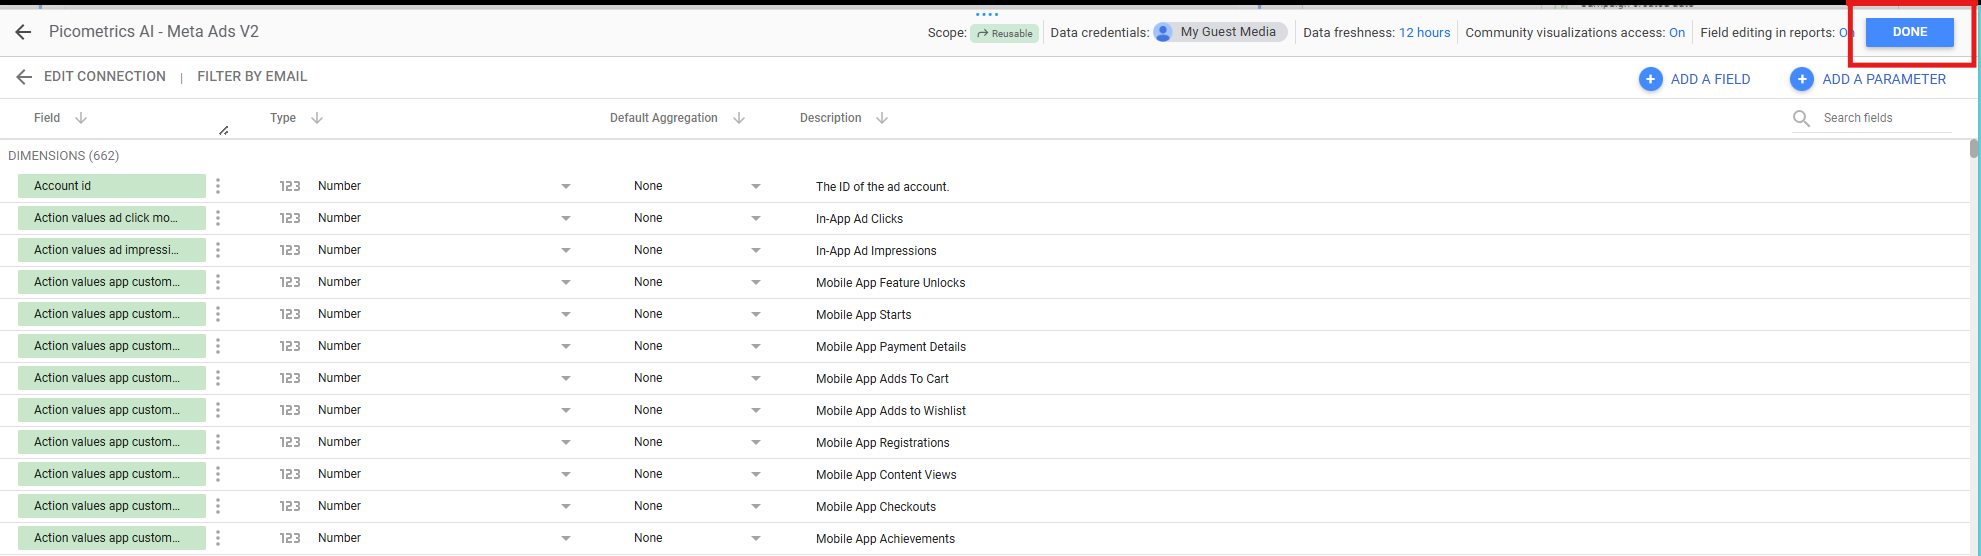
- In the “Add data to report” window, click on “My data sources” then select the Picometrics data source you just configured.
- Click on “DONE” button.
Step 7: Use the Data in Your Report
With the data source added, you can now use the Picometrics data in your Looker Studio report.
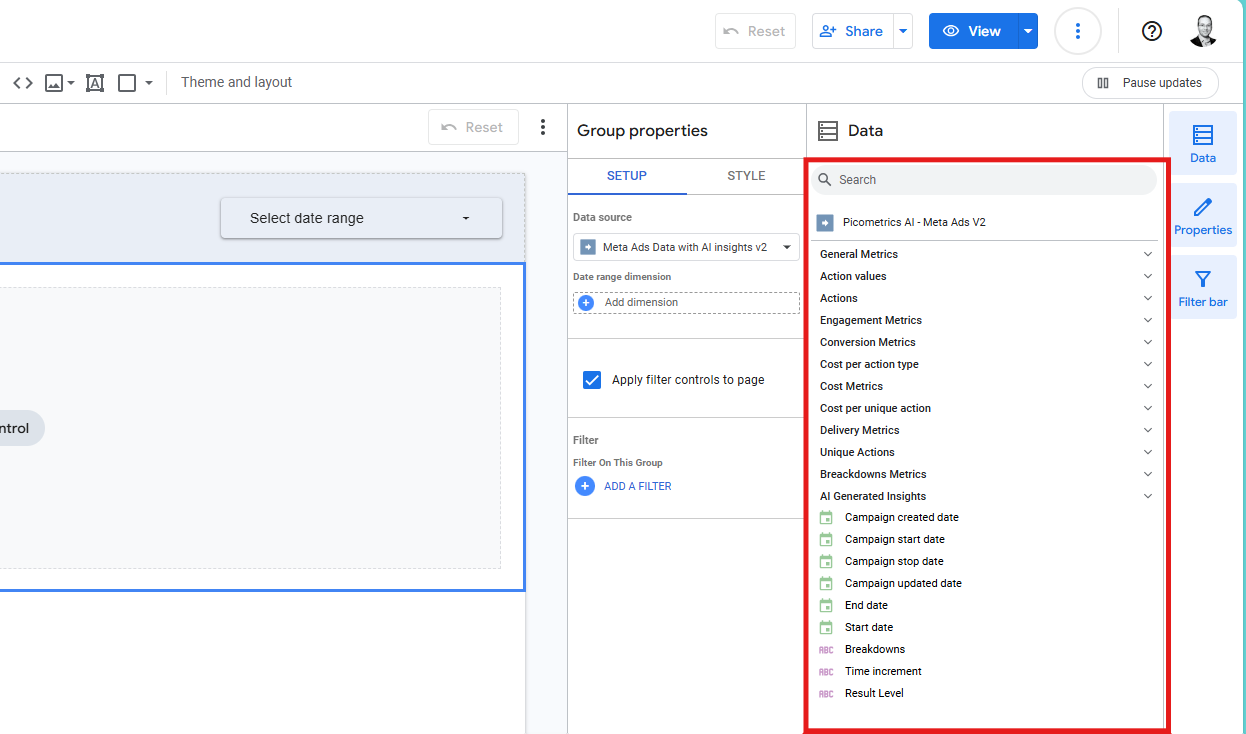
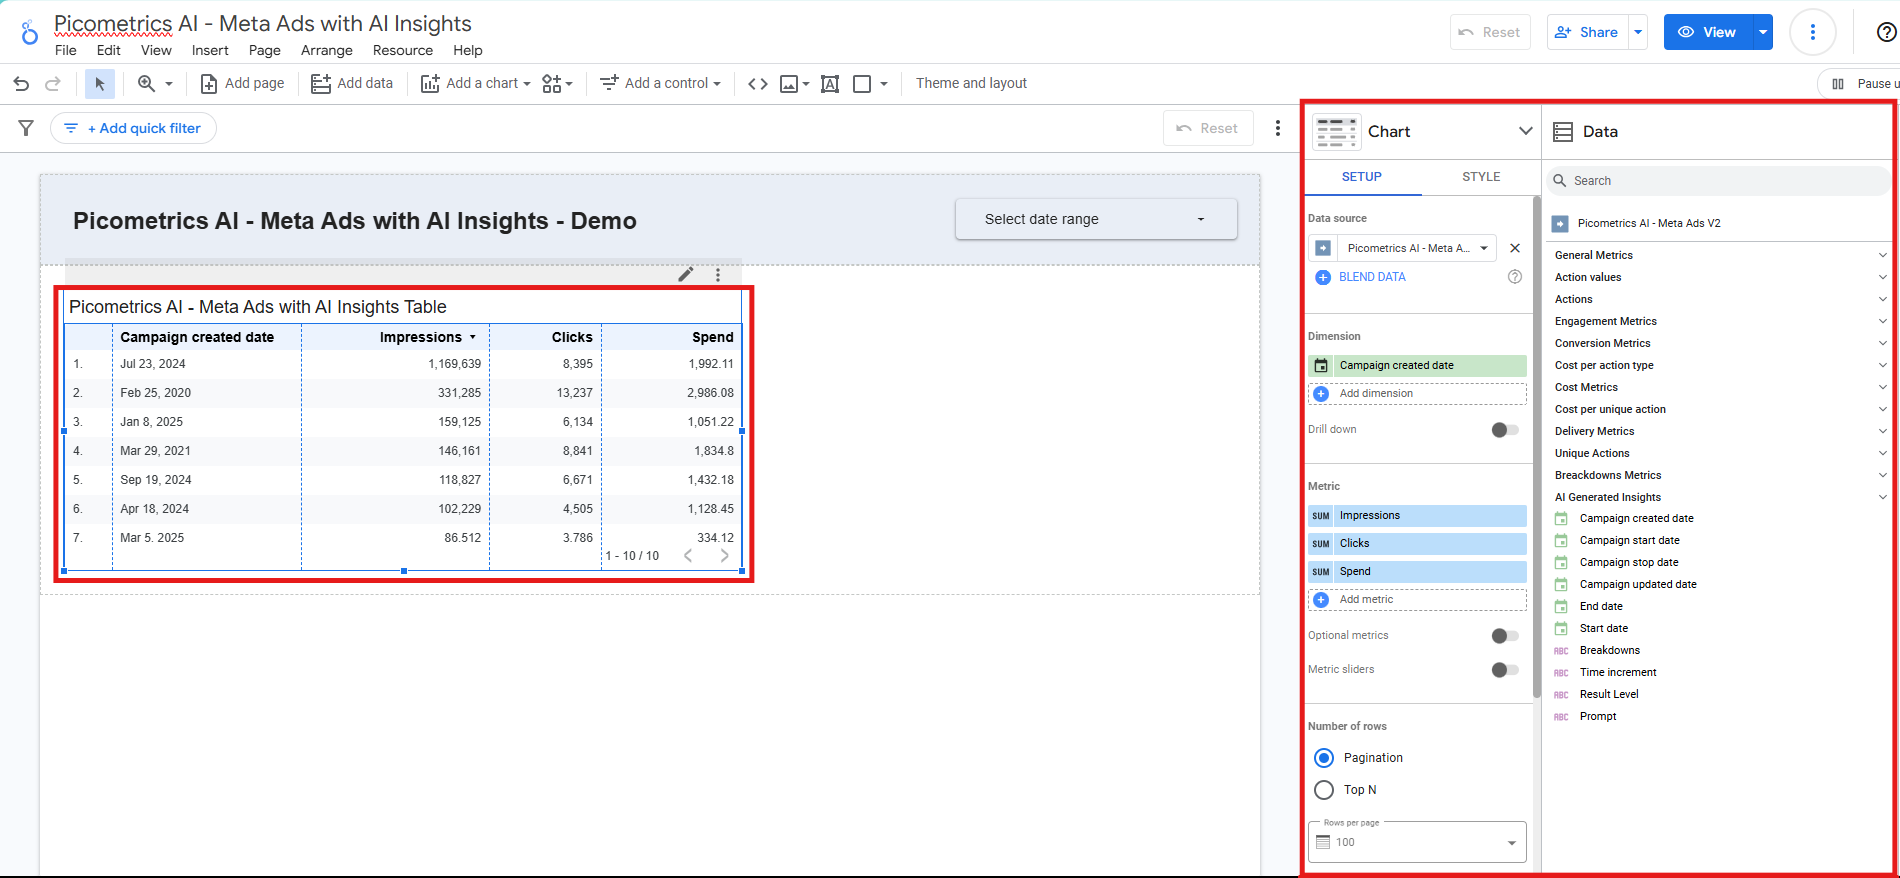
Drag and drop the data fields onto your report canvas to create visualizations and insights.
Step 8: Save and Share Your Report
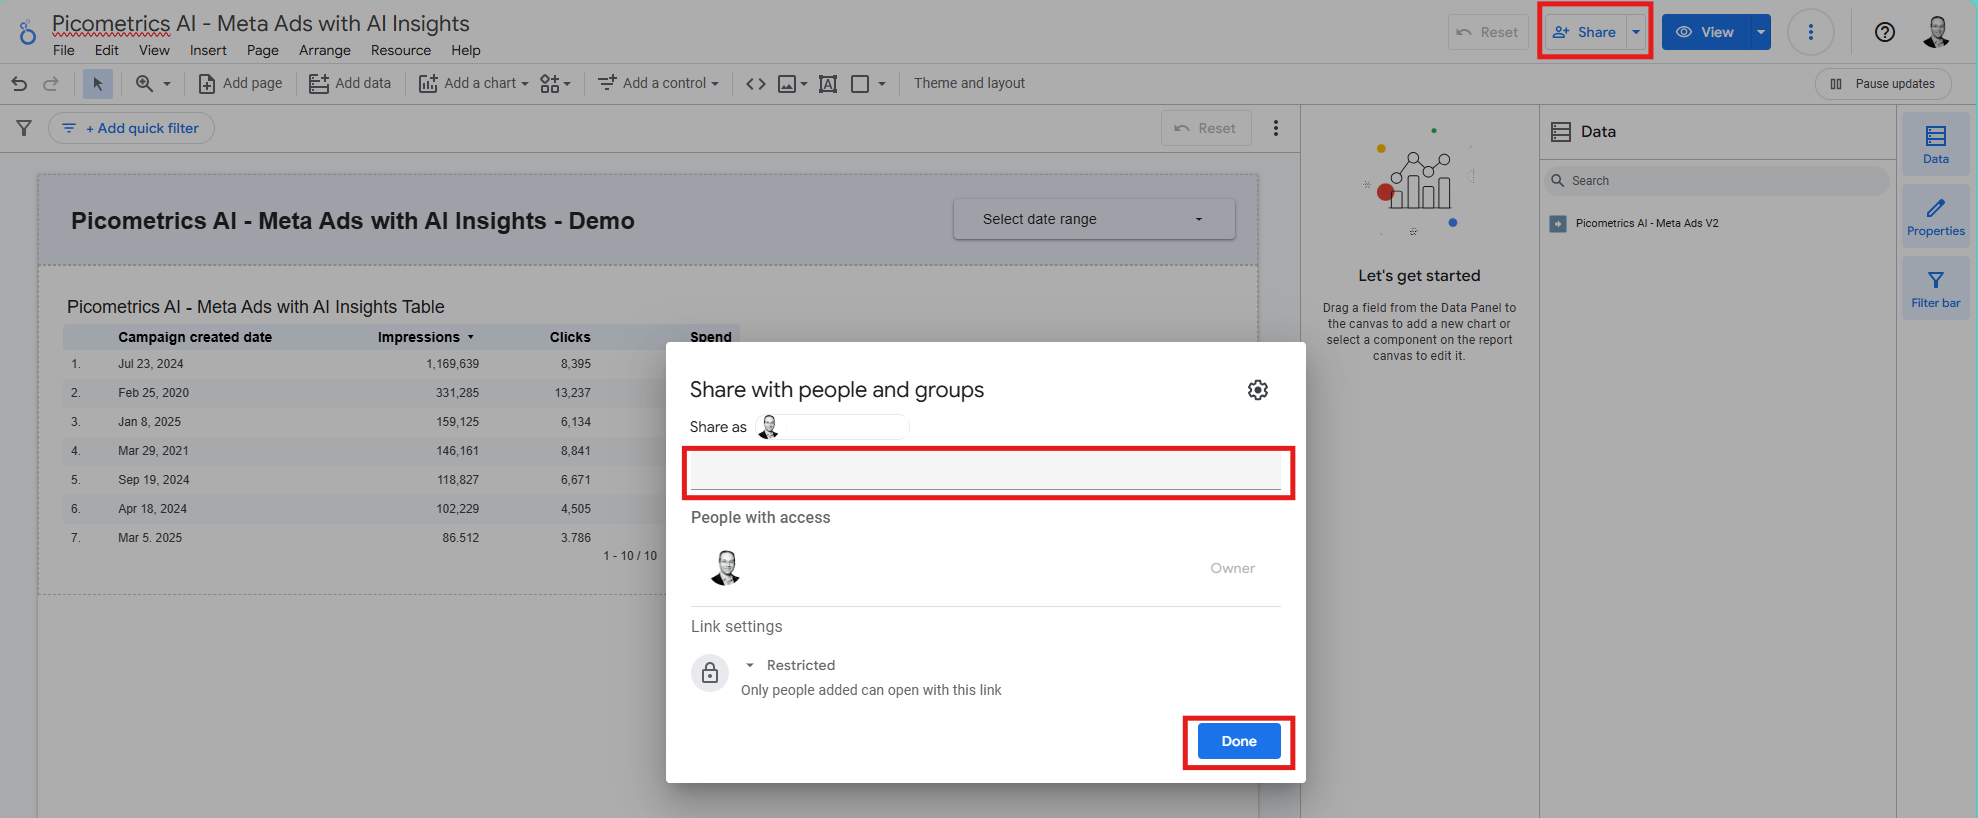
Share the report with your team or stakeholders by generating a shareable link or embedding it in a website.
- Click “Share” button in the upper right corner
- Enter the email accounts of your team members.
- Click the “Done” button, so they will receive a notification with a link to access the report.
And there you have it! You've successfully connected to and used a Picometrics Looker Studio connector. If you have any specific questions or run into any issues, please feel free to ask.